
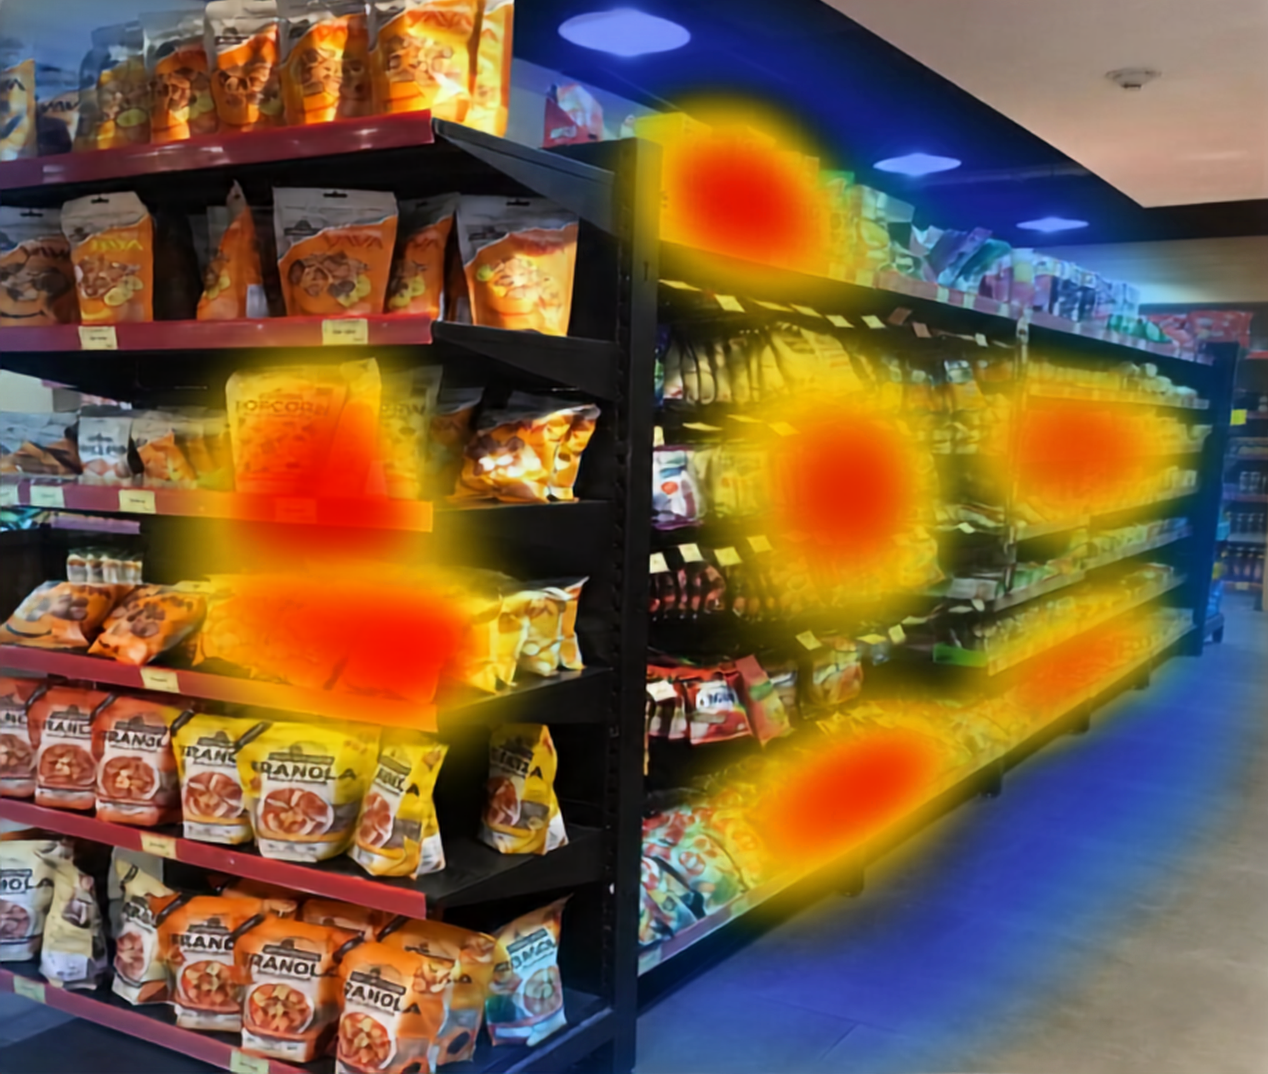
Advanced Heatmap
More than where they walked — learn what they actually stopped for.

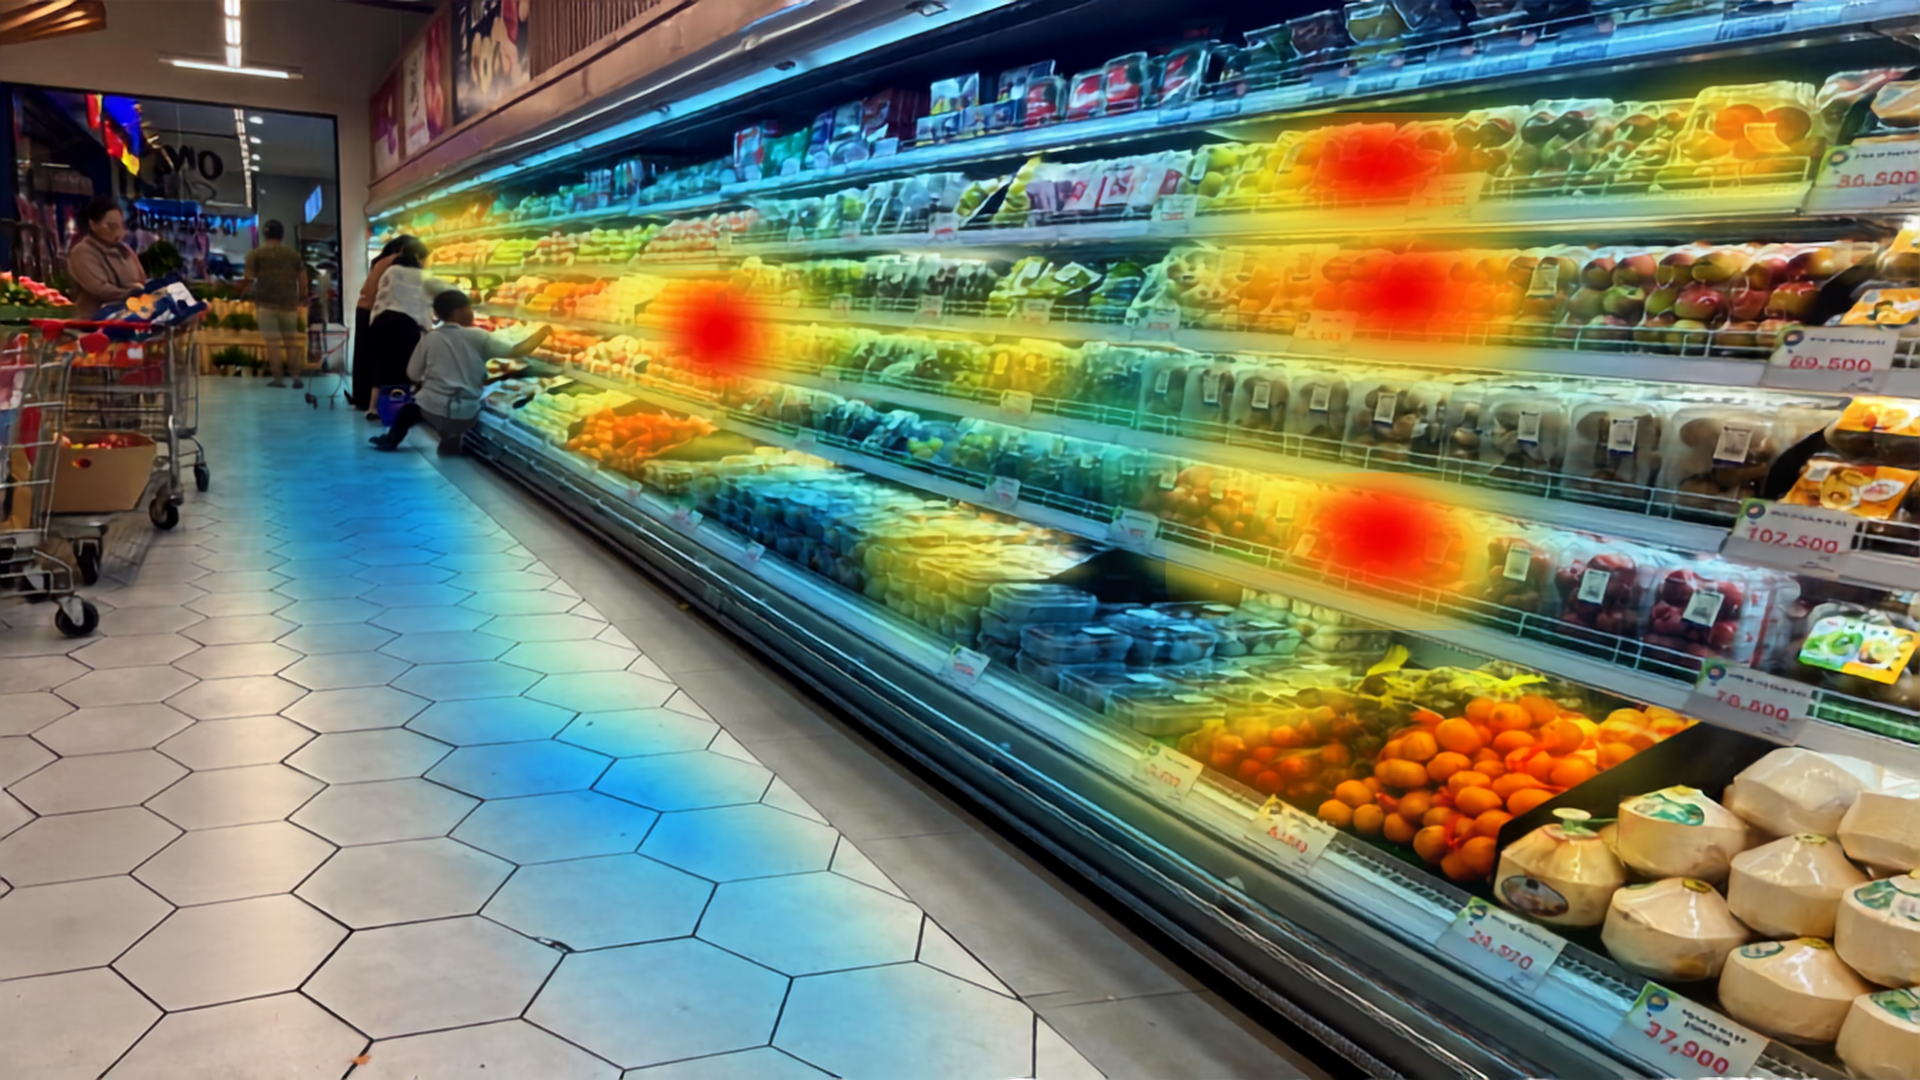
A basic heatmap tells you where people walked. Advanced Heatmap tells you what they cared about — where shoppers stopped, turned, and lingered, shelf by shelf, display by display.
What It Does
Advanced Heatmap uses behavioral analysis to show where customers are actually interested, not just where they walked. Instead of only tracking the path someone took, it identifies where people stopped, which way they were facing and how long they stayed.
That difference matters. An aisle everyone walks through on the way to checkout looks busy on a basic heat map. Advanced Heatmap shows whether anyone actually engaged with what’s on the shelves.
You can set up multiple areas within a single camera view, so each shelf section, end-cap, display table or exhibit gets its own interest score. Compared side by side, the data shows which fixtures earn attention and which are dead space. That gives you clear direction for layout changes, merchandising resets, planogram compliance and staff placement.
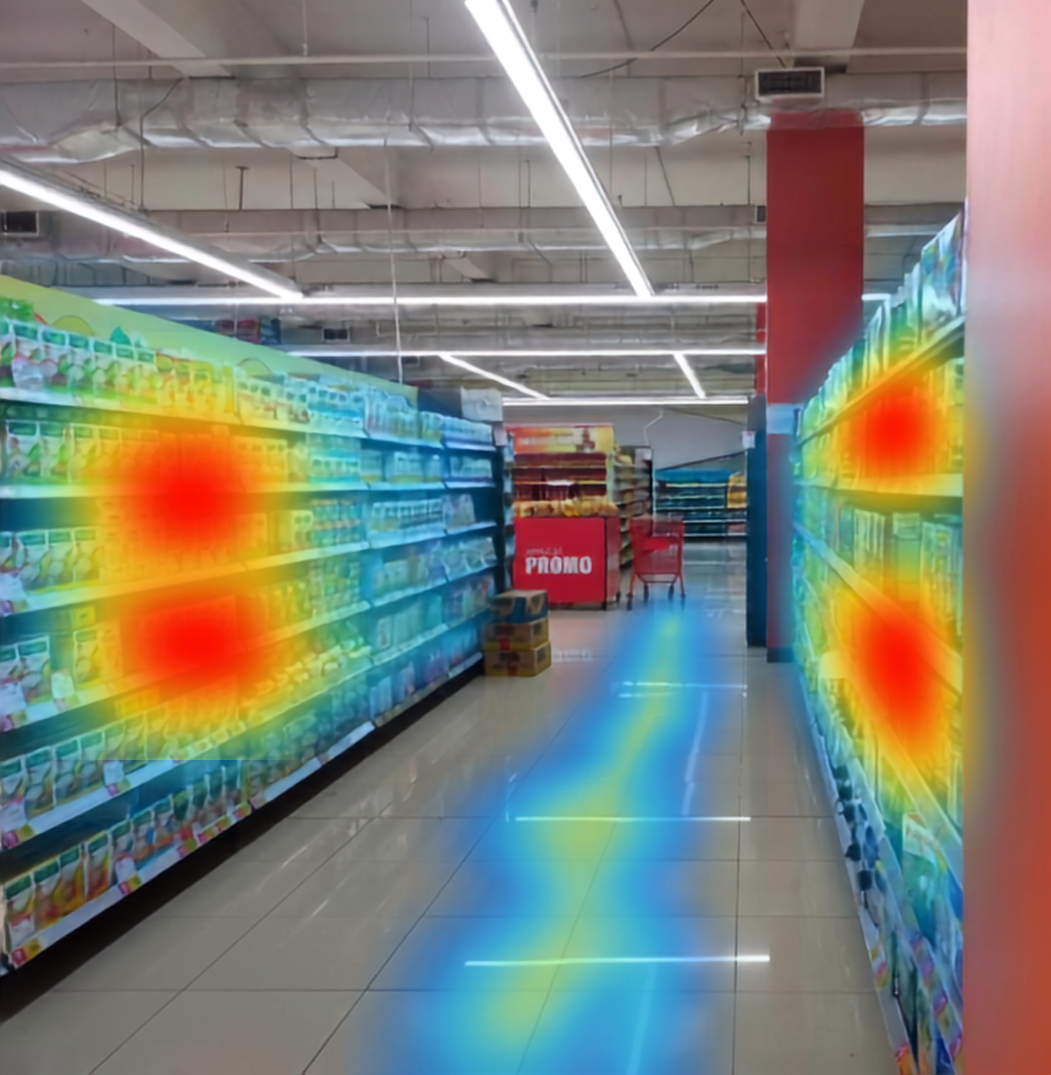
Who Uses It
Settle the End-Cap Argument With Data.
When the seasonal display draws long dwell but the promo shelf next to it gets walked past, you know where the next reset budget should go, and what to charge suppliers for placement.
- Dwell data by end-cap, shelf section, and promo area
- Know which placements earn attention and which get walked past
- Hard numbers to support supplier placement conversations
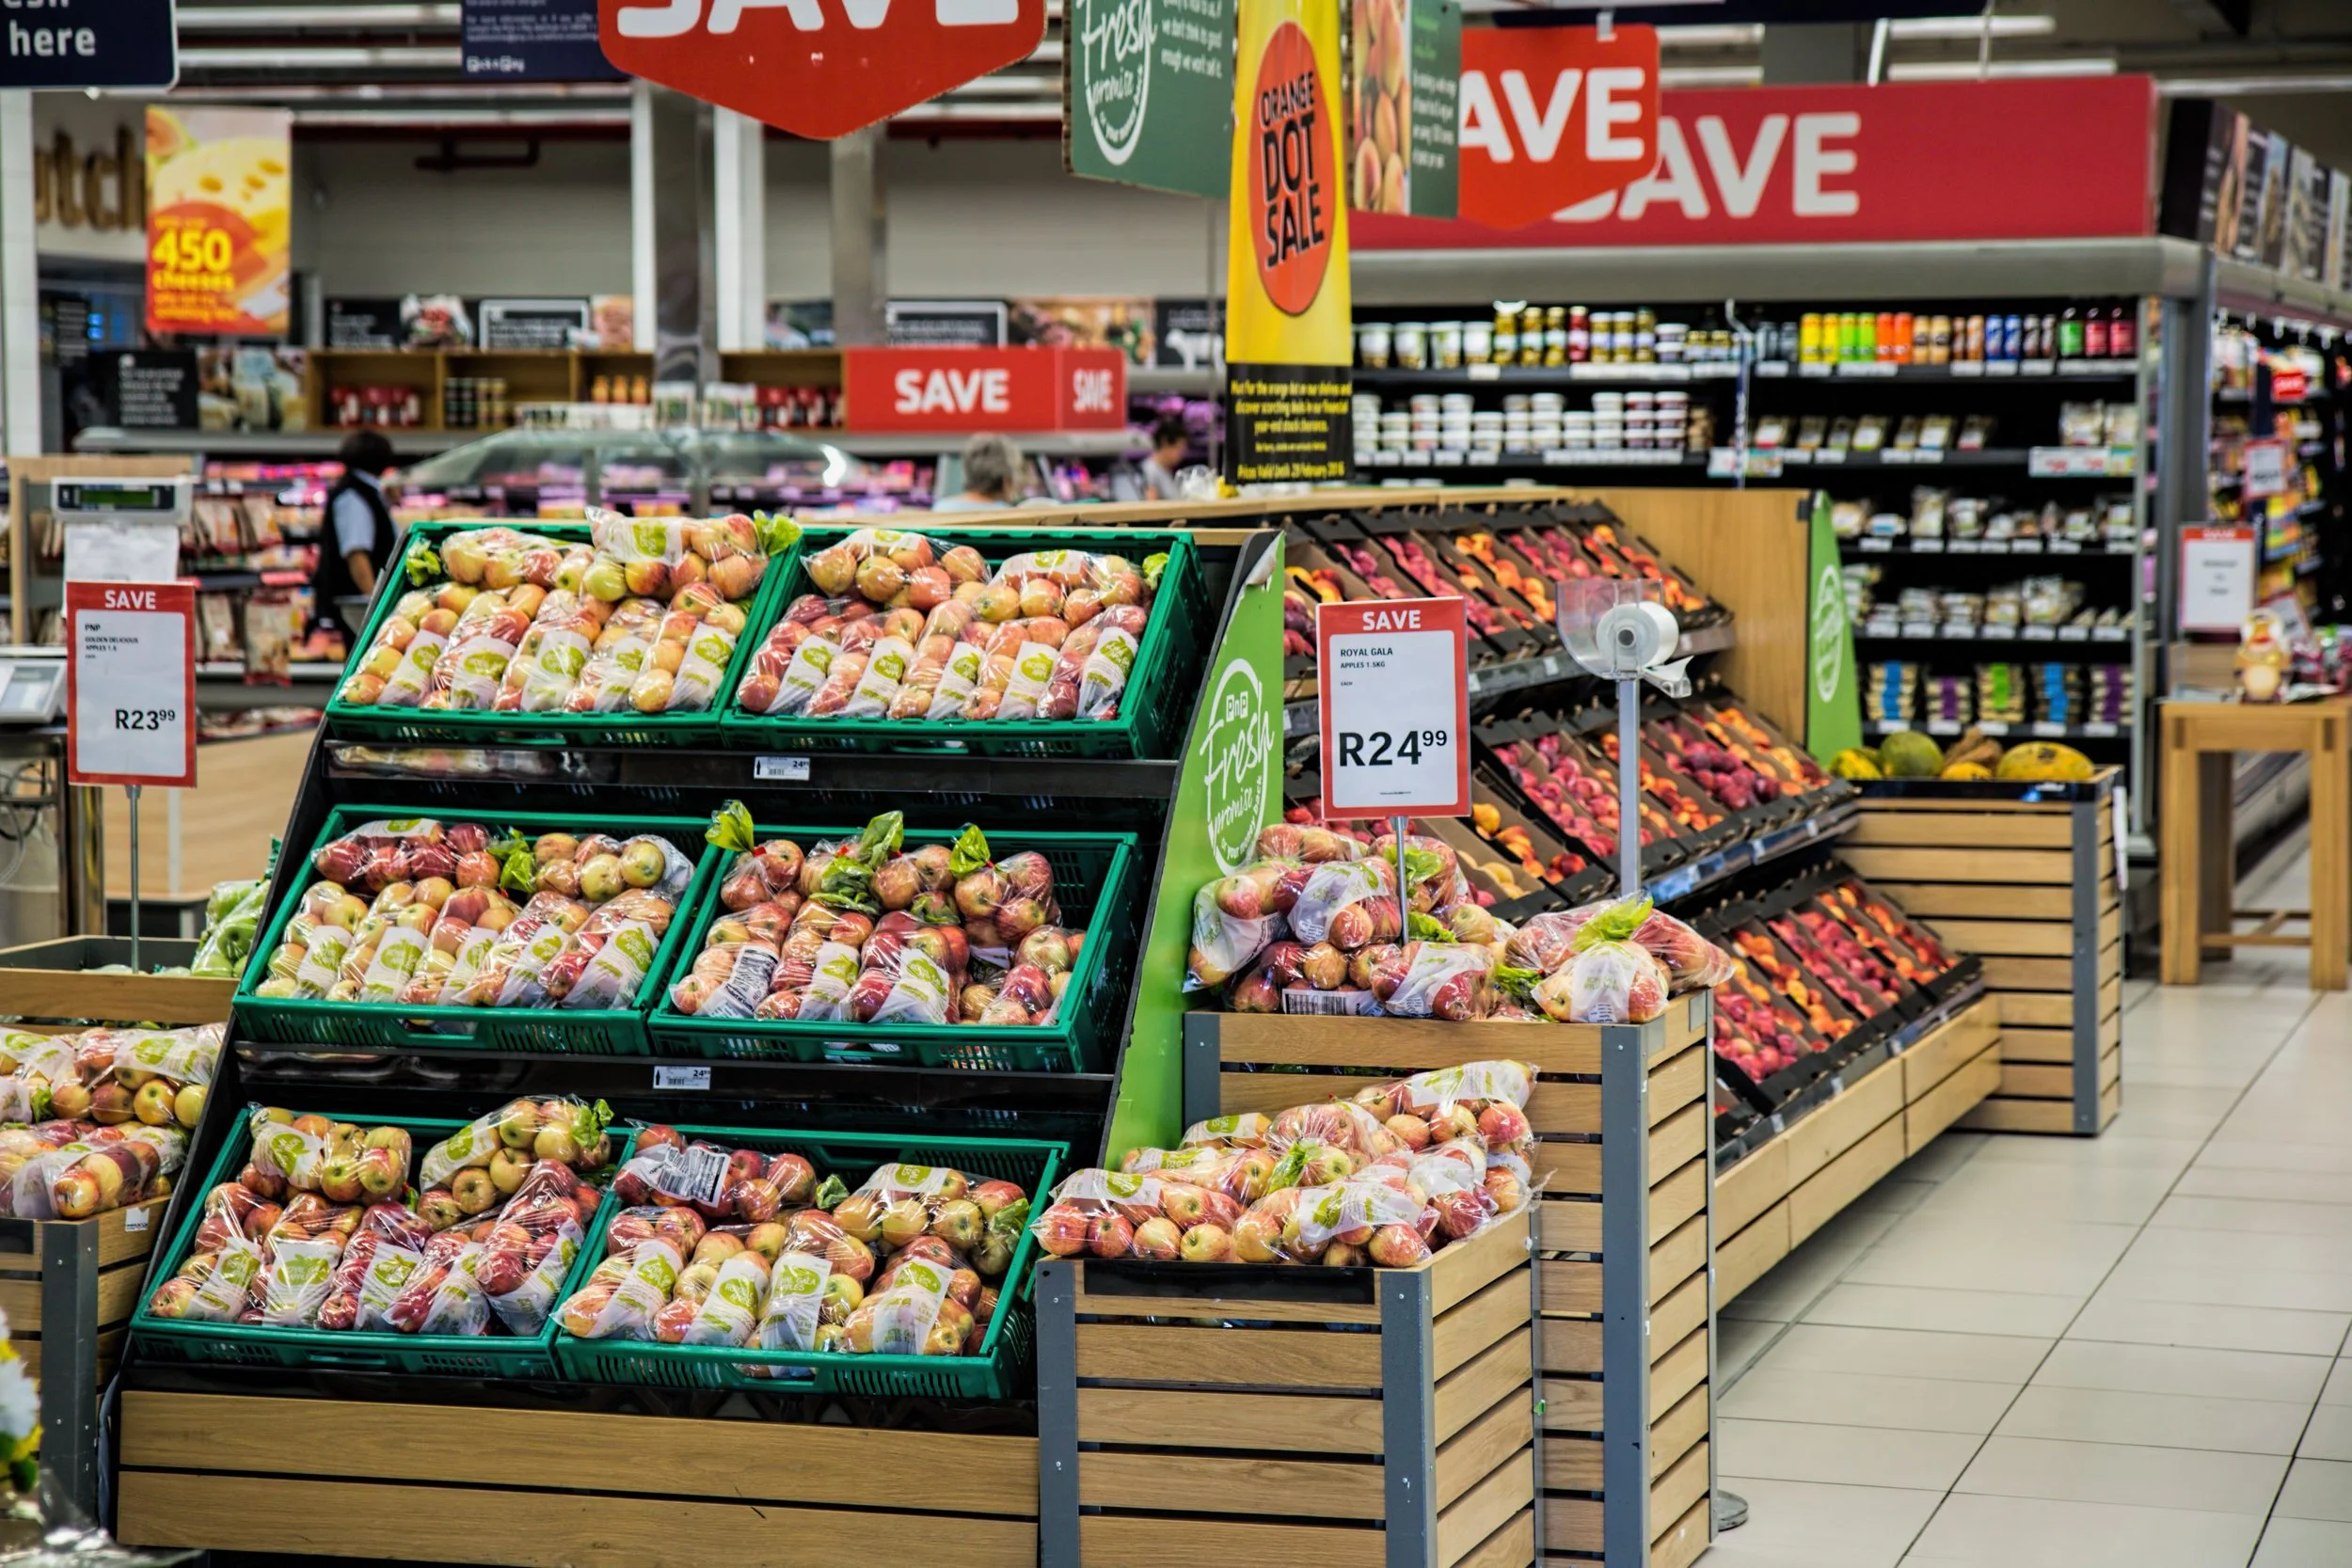
Does Your Front-of-Store Table Stop Shoppers, or Just Slow Them Down?
Measure whether a display earns real interest or just creates friction. Compare results before and after a merchandising change with hard numbers instead of a manager's impression.
- Interest data before and after a merchandising reset
- Tell apart displays that stop shoppers from ones they walk around
- Evidence to settle layout debates without relying on gut feel

Prove Display Performance to Retail Partners With Interest Data, Not Impressions.
Interest data for each shelf area shows whether a new package or planogram earns engagement, not just distribution. Give your retail partners evidence instead of assumptions.
- Shelf-level interest scores for every configured display area
- Measure whether a new planogram or package earns engagement
- Data to support placement negotiations with retail partners

Score Every Kiosk and Pop-Up, and Price the Zones That Earn Attention.
Score interest at kiosks, pop-ups, and exhibit areas to set lease rates for high-engagement zones and rework the ones visitors walk past without stopping.
- Interest scores for each kiosk, pop-up, and exhibit area
- Data to price high-engagement zones at premium rates
- Identify low-interest areas before renewing a tenant or placement

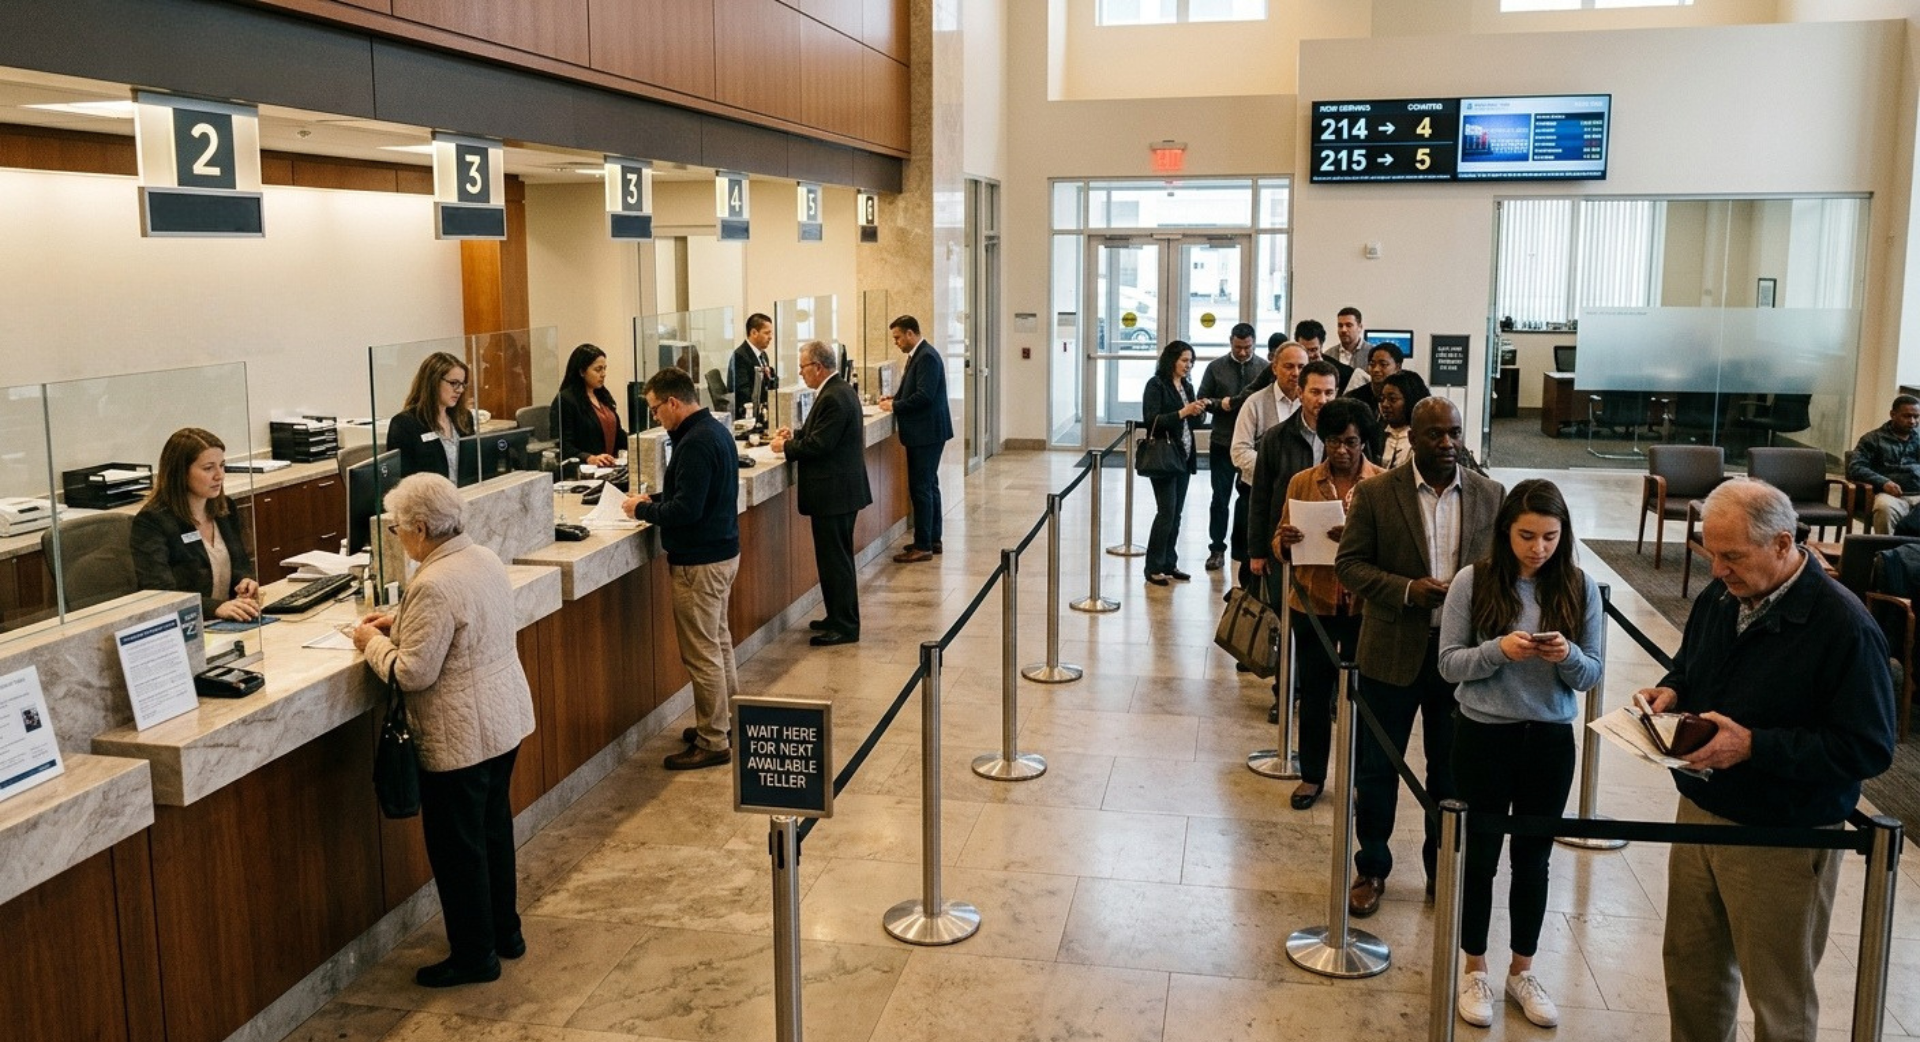
Place Staff Where Customer Interest Is Highest, Not Where It's Assumed to Be.
See which product displays, rate boards, and demo stations customers actually study while they wait. Then place staff where the data shows attention is highest.
- Interest data for each display, rate board, and demo station
- Staff placement guided by where customers actually engage
- Compare interest across branch locations to standardize layouts
How It Works
Advanced Heatmap runs on the same DICE-monitored cameras that secure your store. During business hours, the AI collects behavioral interest data across every area you’ve set up, giving you clear insight for merchandising and layout decisions. After hours, those same cameras switch to 24/7 live security monitoring by DICE’s operators. One platform, working for your business around the clock.
FAQs
-
The standard Heatmap measures presence — where people have been detected, showing high- and low-activity areas over time. Advanced Heatmap goes further: it analyzes behavior — stopping, facing, lingering — to measure interest, so a high-traffic pass-through aisle no longer looks the same as a display shoppers actually engage with.
-
Yes. Multiple areas can be configured within a single camera view — each shelf, endcap, or exhibit zone is scored independently, then compared side by side.
-
No. The output is aggregated heat map data reflecting interest levels across configured areas — it is a merchandising measurement tool, not a tracking or identification system.