
Heatmap Analytics
See which parts of your floor earn their square footage — and which ones don't.

Your cameras already see every customer who walks your floor. Heatmap Analytics turns that footage into a picture of how your space actually performs.
What It Does
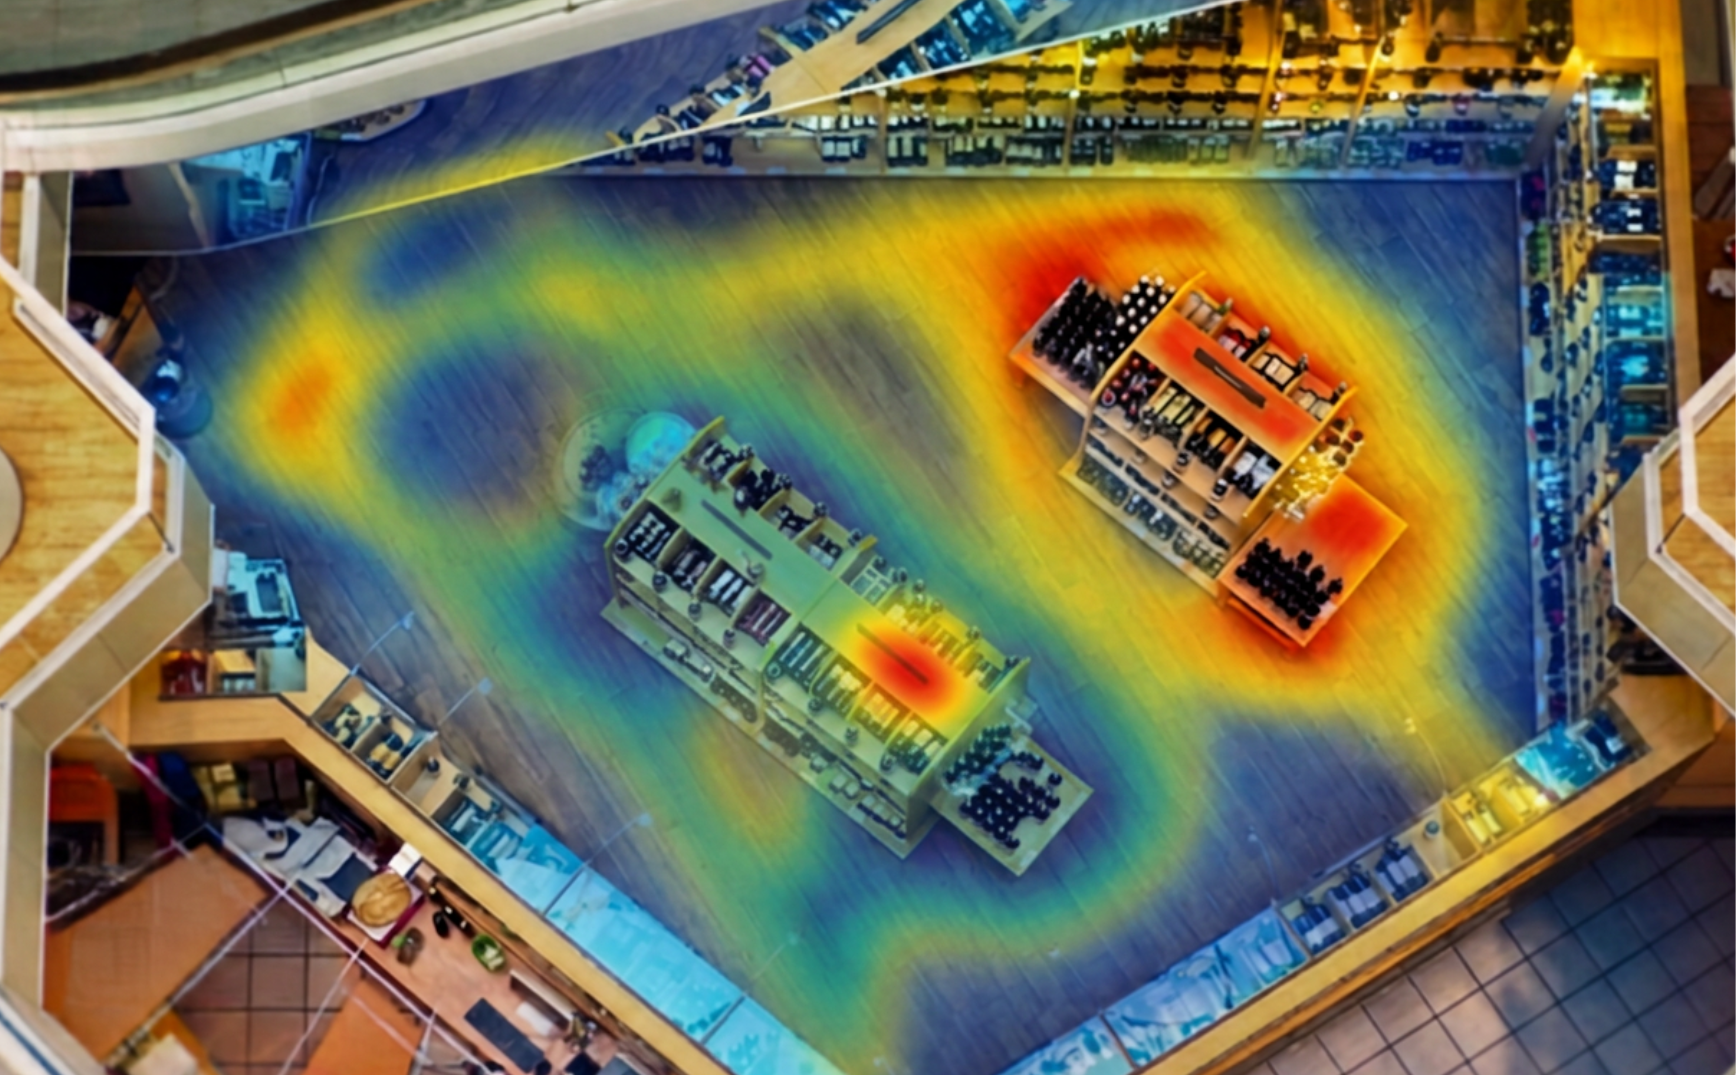
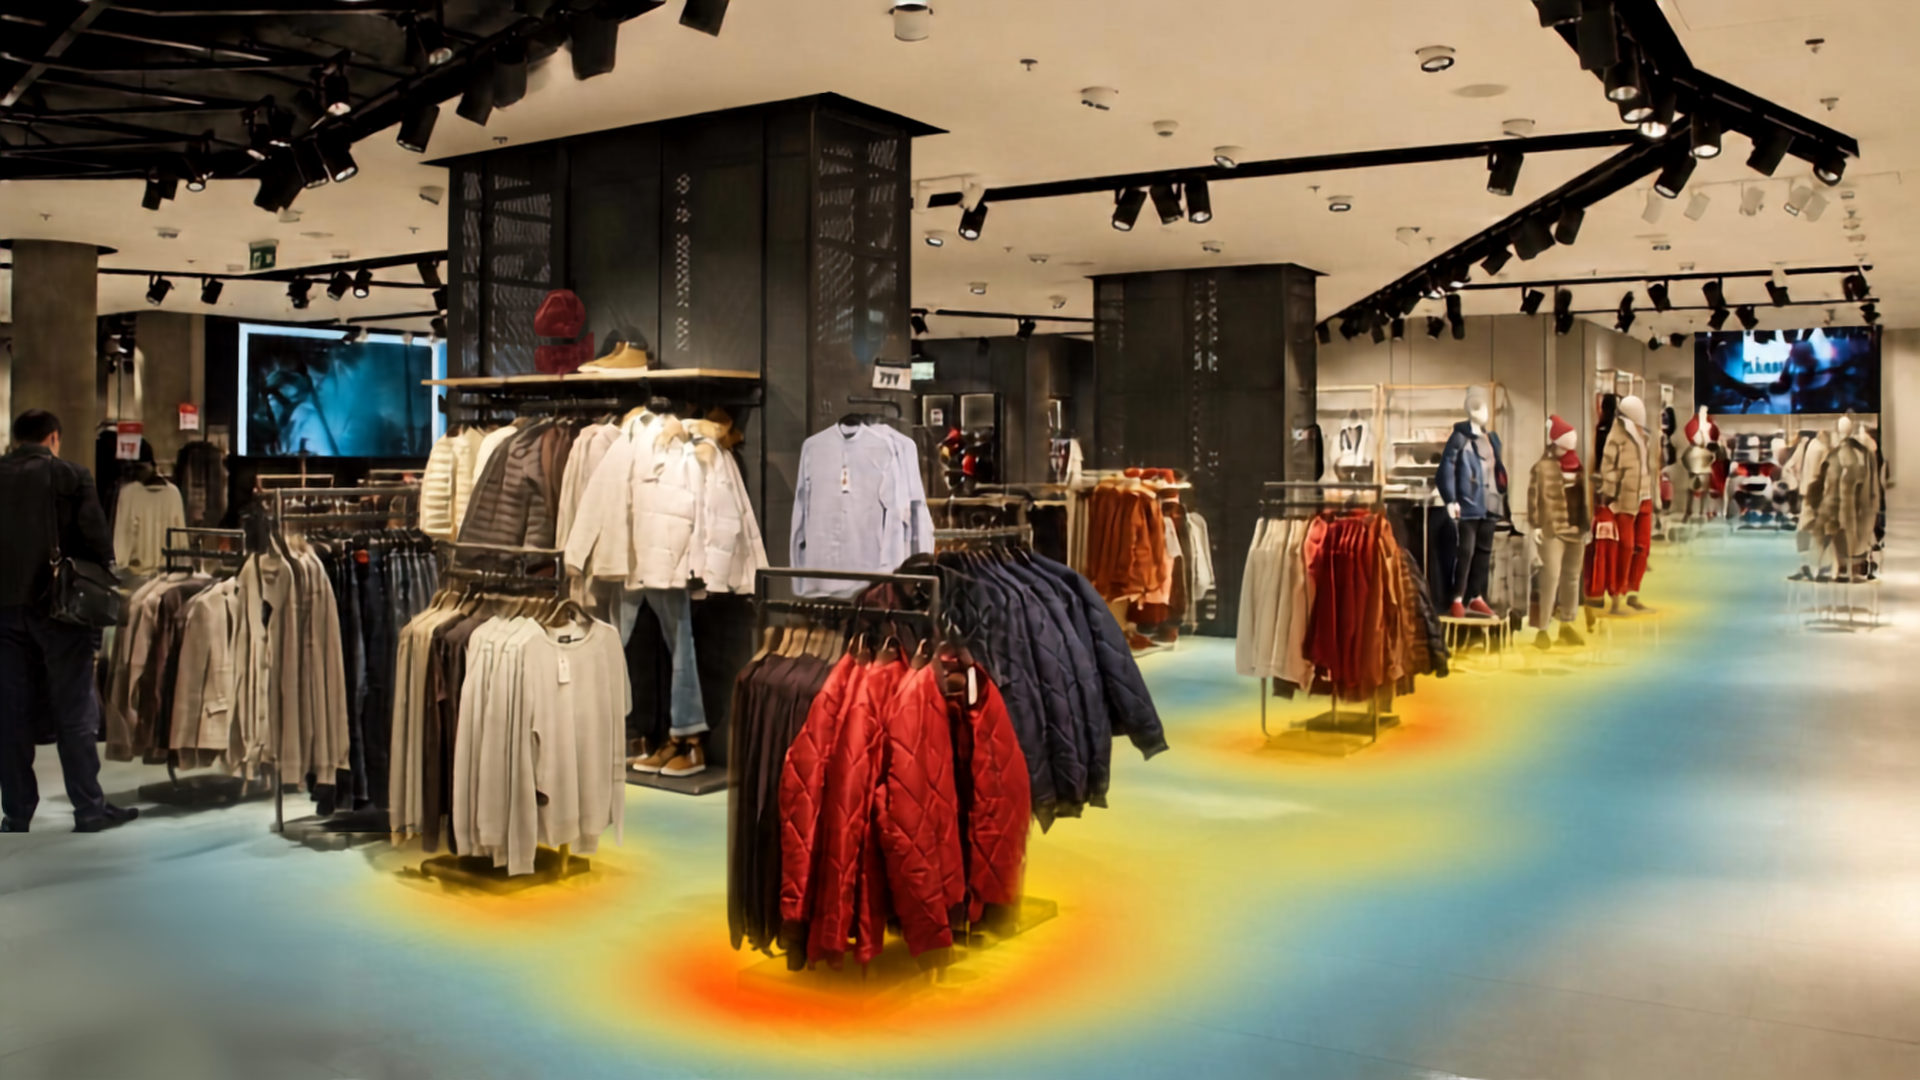
Heatmap Analytics collects people-detection data over time, whether that’s days, weeks or an entire season, and turns it into a visual heat map of your floor. Red shows where traffic concentrates, and cooler colors show where it doesn’t. Because data builds over a measurement period you set, rather than a single snapshot, you see real patterns instead of guesswork.
You choose the areas to measure, such as a department, an end-cap, a lobby or a platform. The map then shows exactly which parts of your facility are earning their square footage and which are dead zones.
Who Uses It
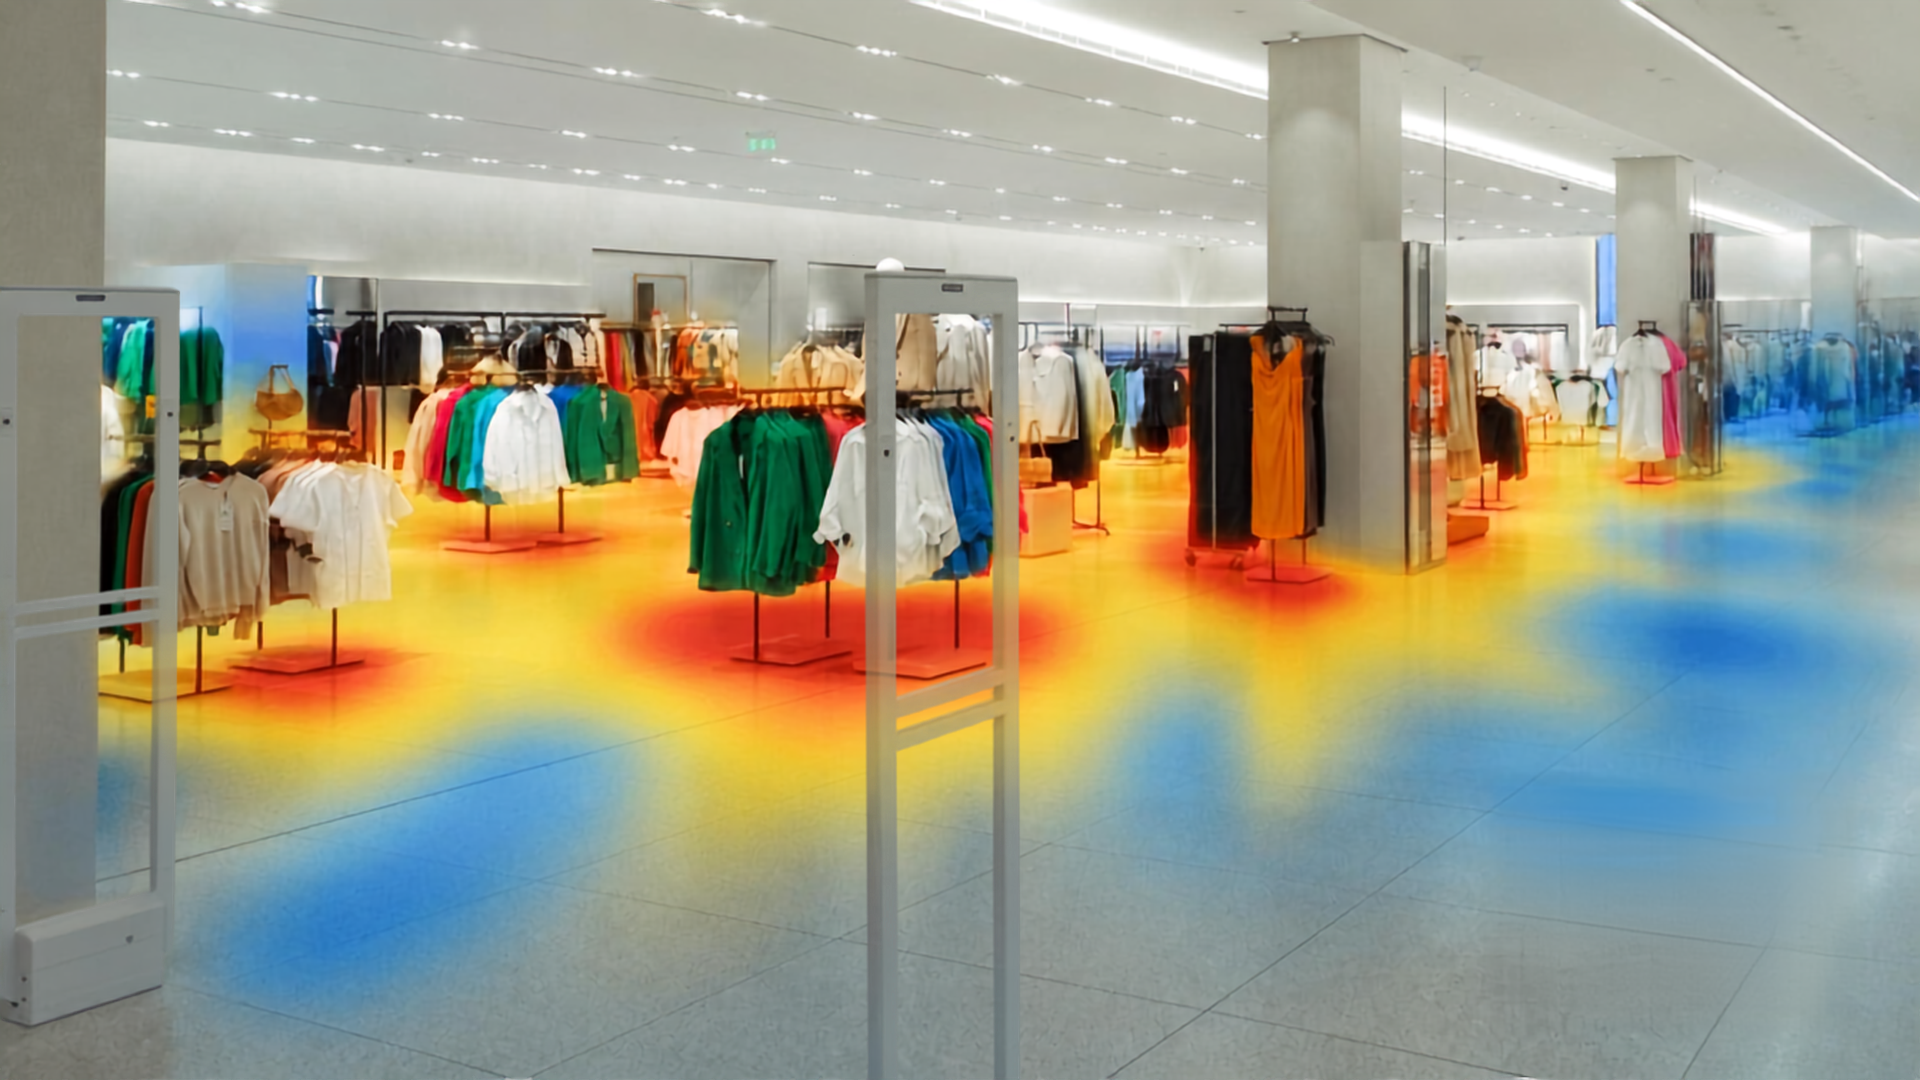
If a Promotion Sits in a Cold Zone, You'll See It.
Validate planograms and end-cap placement with evidence instead of instinct. The heat map shows exactly which parts of your floor earn their square footage, and the lift you get when you move something that doesn't.
- Validate end-cap and display placement with traffic data
- Identify cold zones before a promotion lands in one
- Measure the lift when you reposition a display or reset a department

Price Tenant Spaces and Justify Rates With Real Traffic Data.
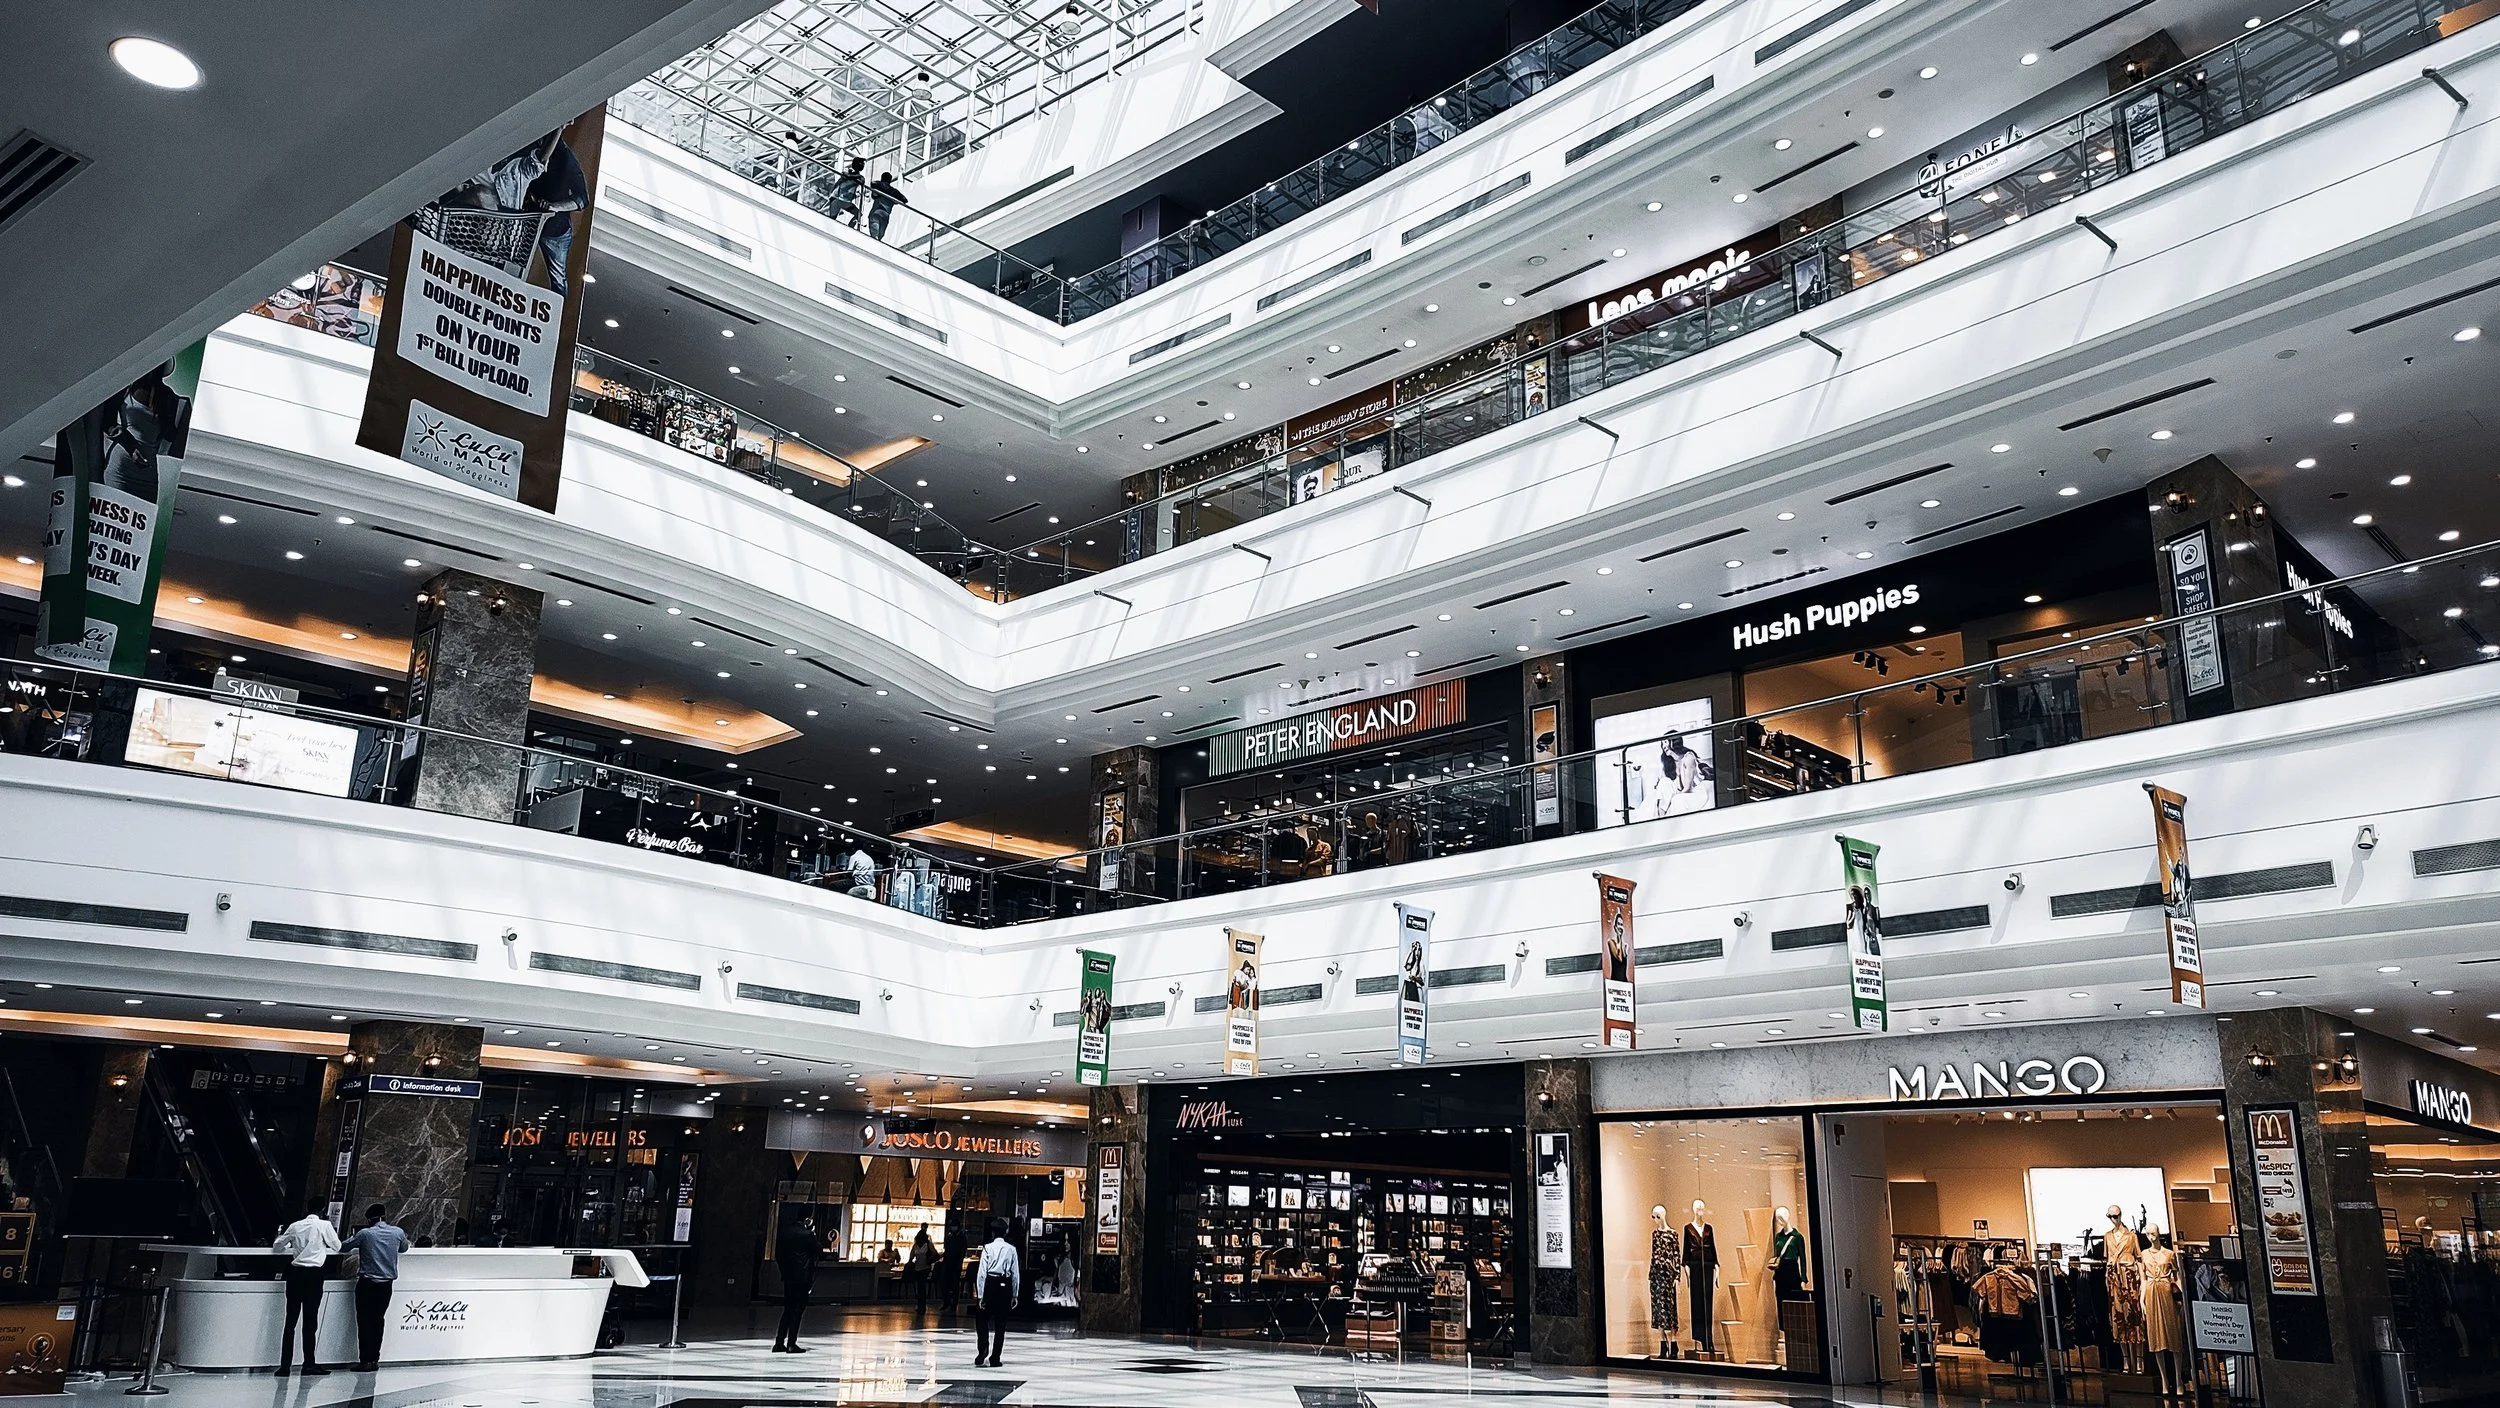
Measure corridor flow and common-area usage to position kiosks, price tenant spaces, and settle rate conversations with data instead of estimates.
- Corridor flow and common-area usage measured continuously
- Data to support tenant pricing and kiosk placement decisions
- Justify rates to prospective tenants with evidence, not estimates
See Where Queues Build and Where Menu-Board Dwell Actually Happens.
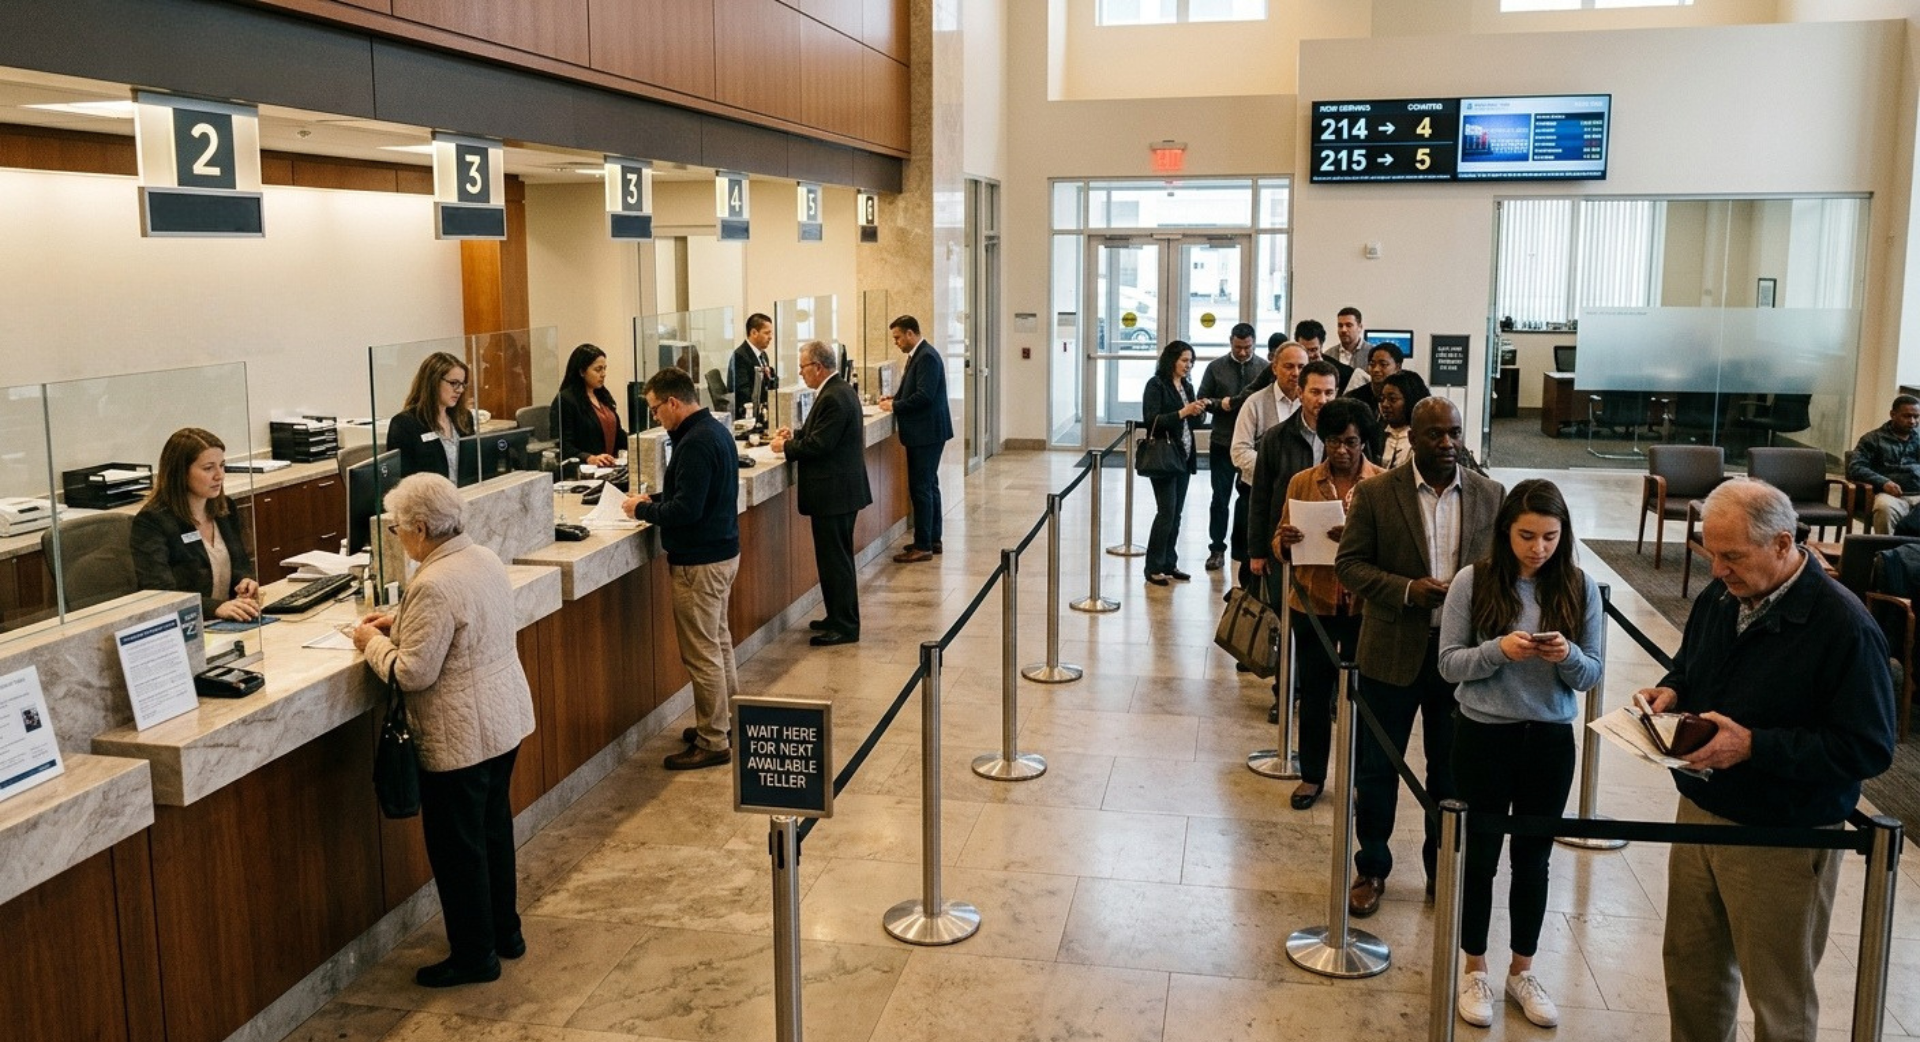
Understand where queues build and how long customers linger at the menu board, then redesign your layout for faster throughput. Stop losing customers to lines they can see before they join.
- Identify queue buildup zones at peak hours
- Measure menu-board dwell to inform placement and design
- Use layout data to redesign for faster throughput

Compare Identical Layouts Across Locations and Standardize on What Works.
When every branch runs the same layout, traffic data reveals which version of "identical" actually performs best, and gives you the evidence to standardize on it across your network.
- Compare traffic patterns across branches with the same layout
- Identify which floor configurations drive more engagement
- Standardize on measurable performance across the network
Direct Budgets to Where People Actually Go, Not Where You Assumed They Would.
See which platforms, exhibits, or study areas get used and which sit empty. Cleaning, staffing, and capital investment decisions can follow the traffic instead of the original plan.
- Usage data for platforms, exhibits, and study areas
- Cleaning and staffing schedules driven by actual traffic patterns
- Capital investment directed where usage justifies it
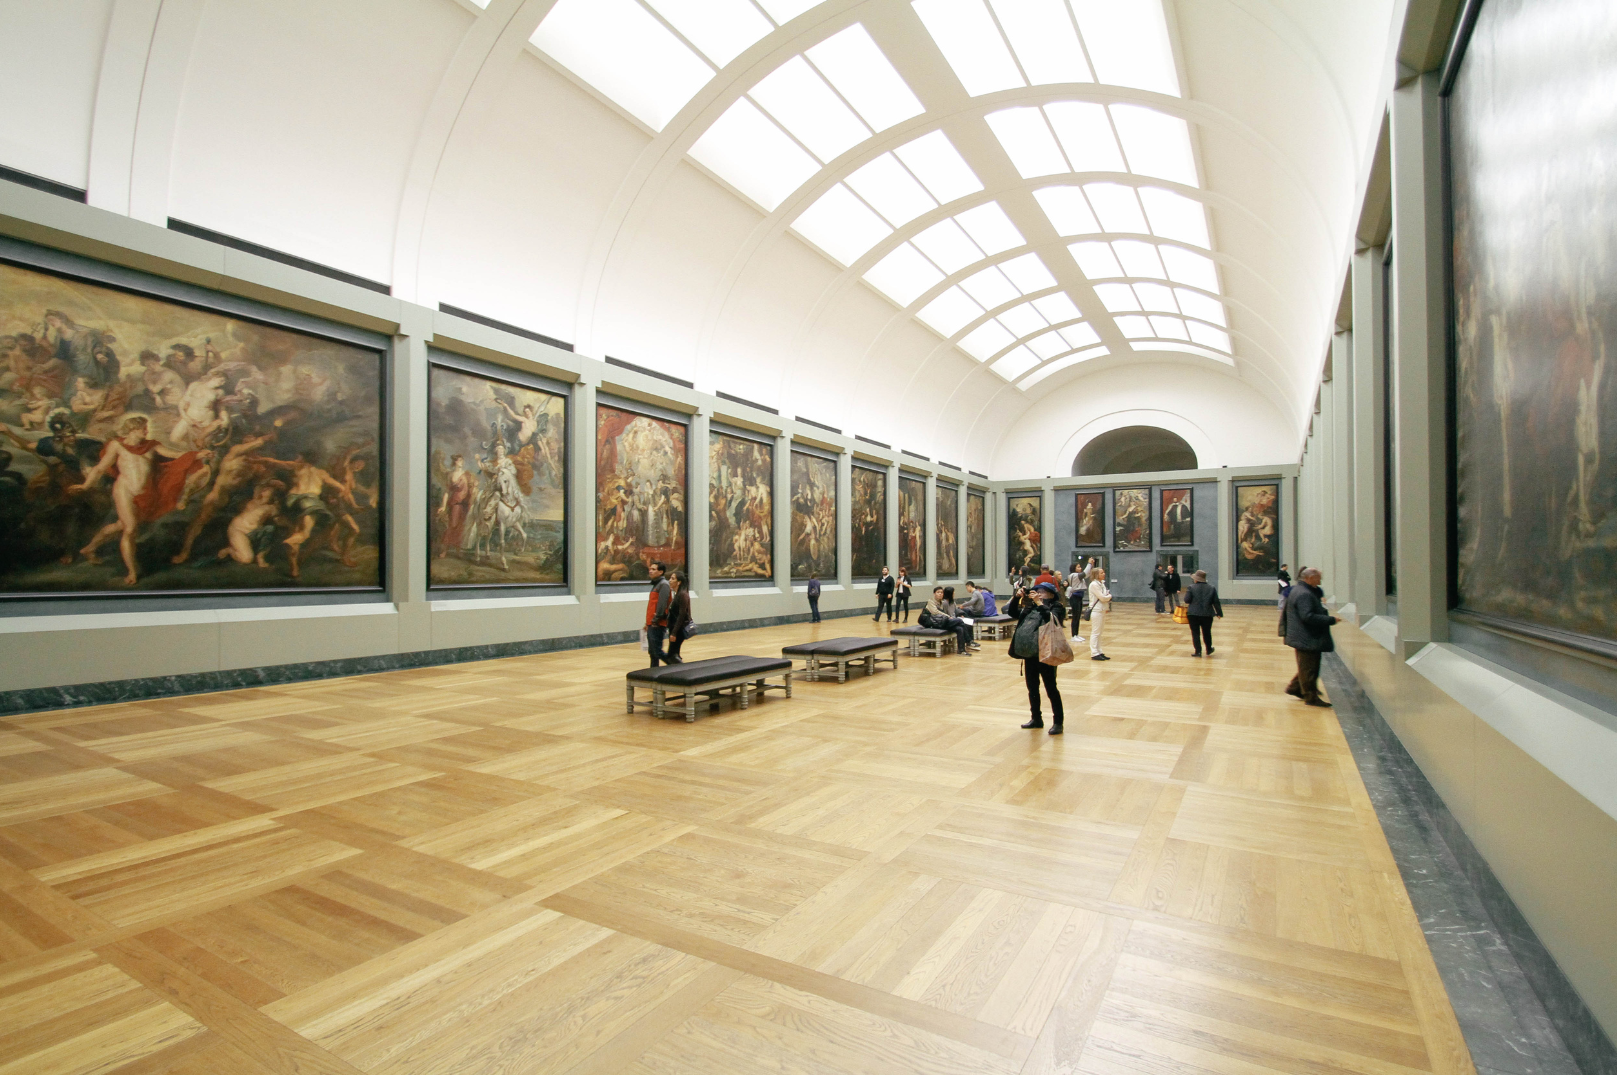
Schedule Cleaning and Maintenance Where the Traffic Actually Is.
Calendar-based cleaning schedules don't know that the north corridor gets three times the foot traffic on Thursdays. Heatmap data does, and your maintenance schedule can too.
- Traffic data by zone and time period for maintenance planning
- Cleaning resources directed to high-use areas, not fixed schedules
- Runs on your existing DICE-monitored cameras, with no separate sensor network required
How It Works
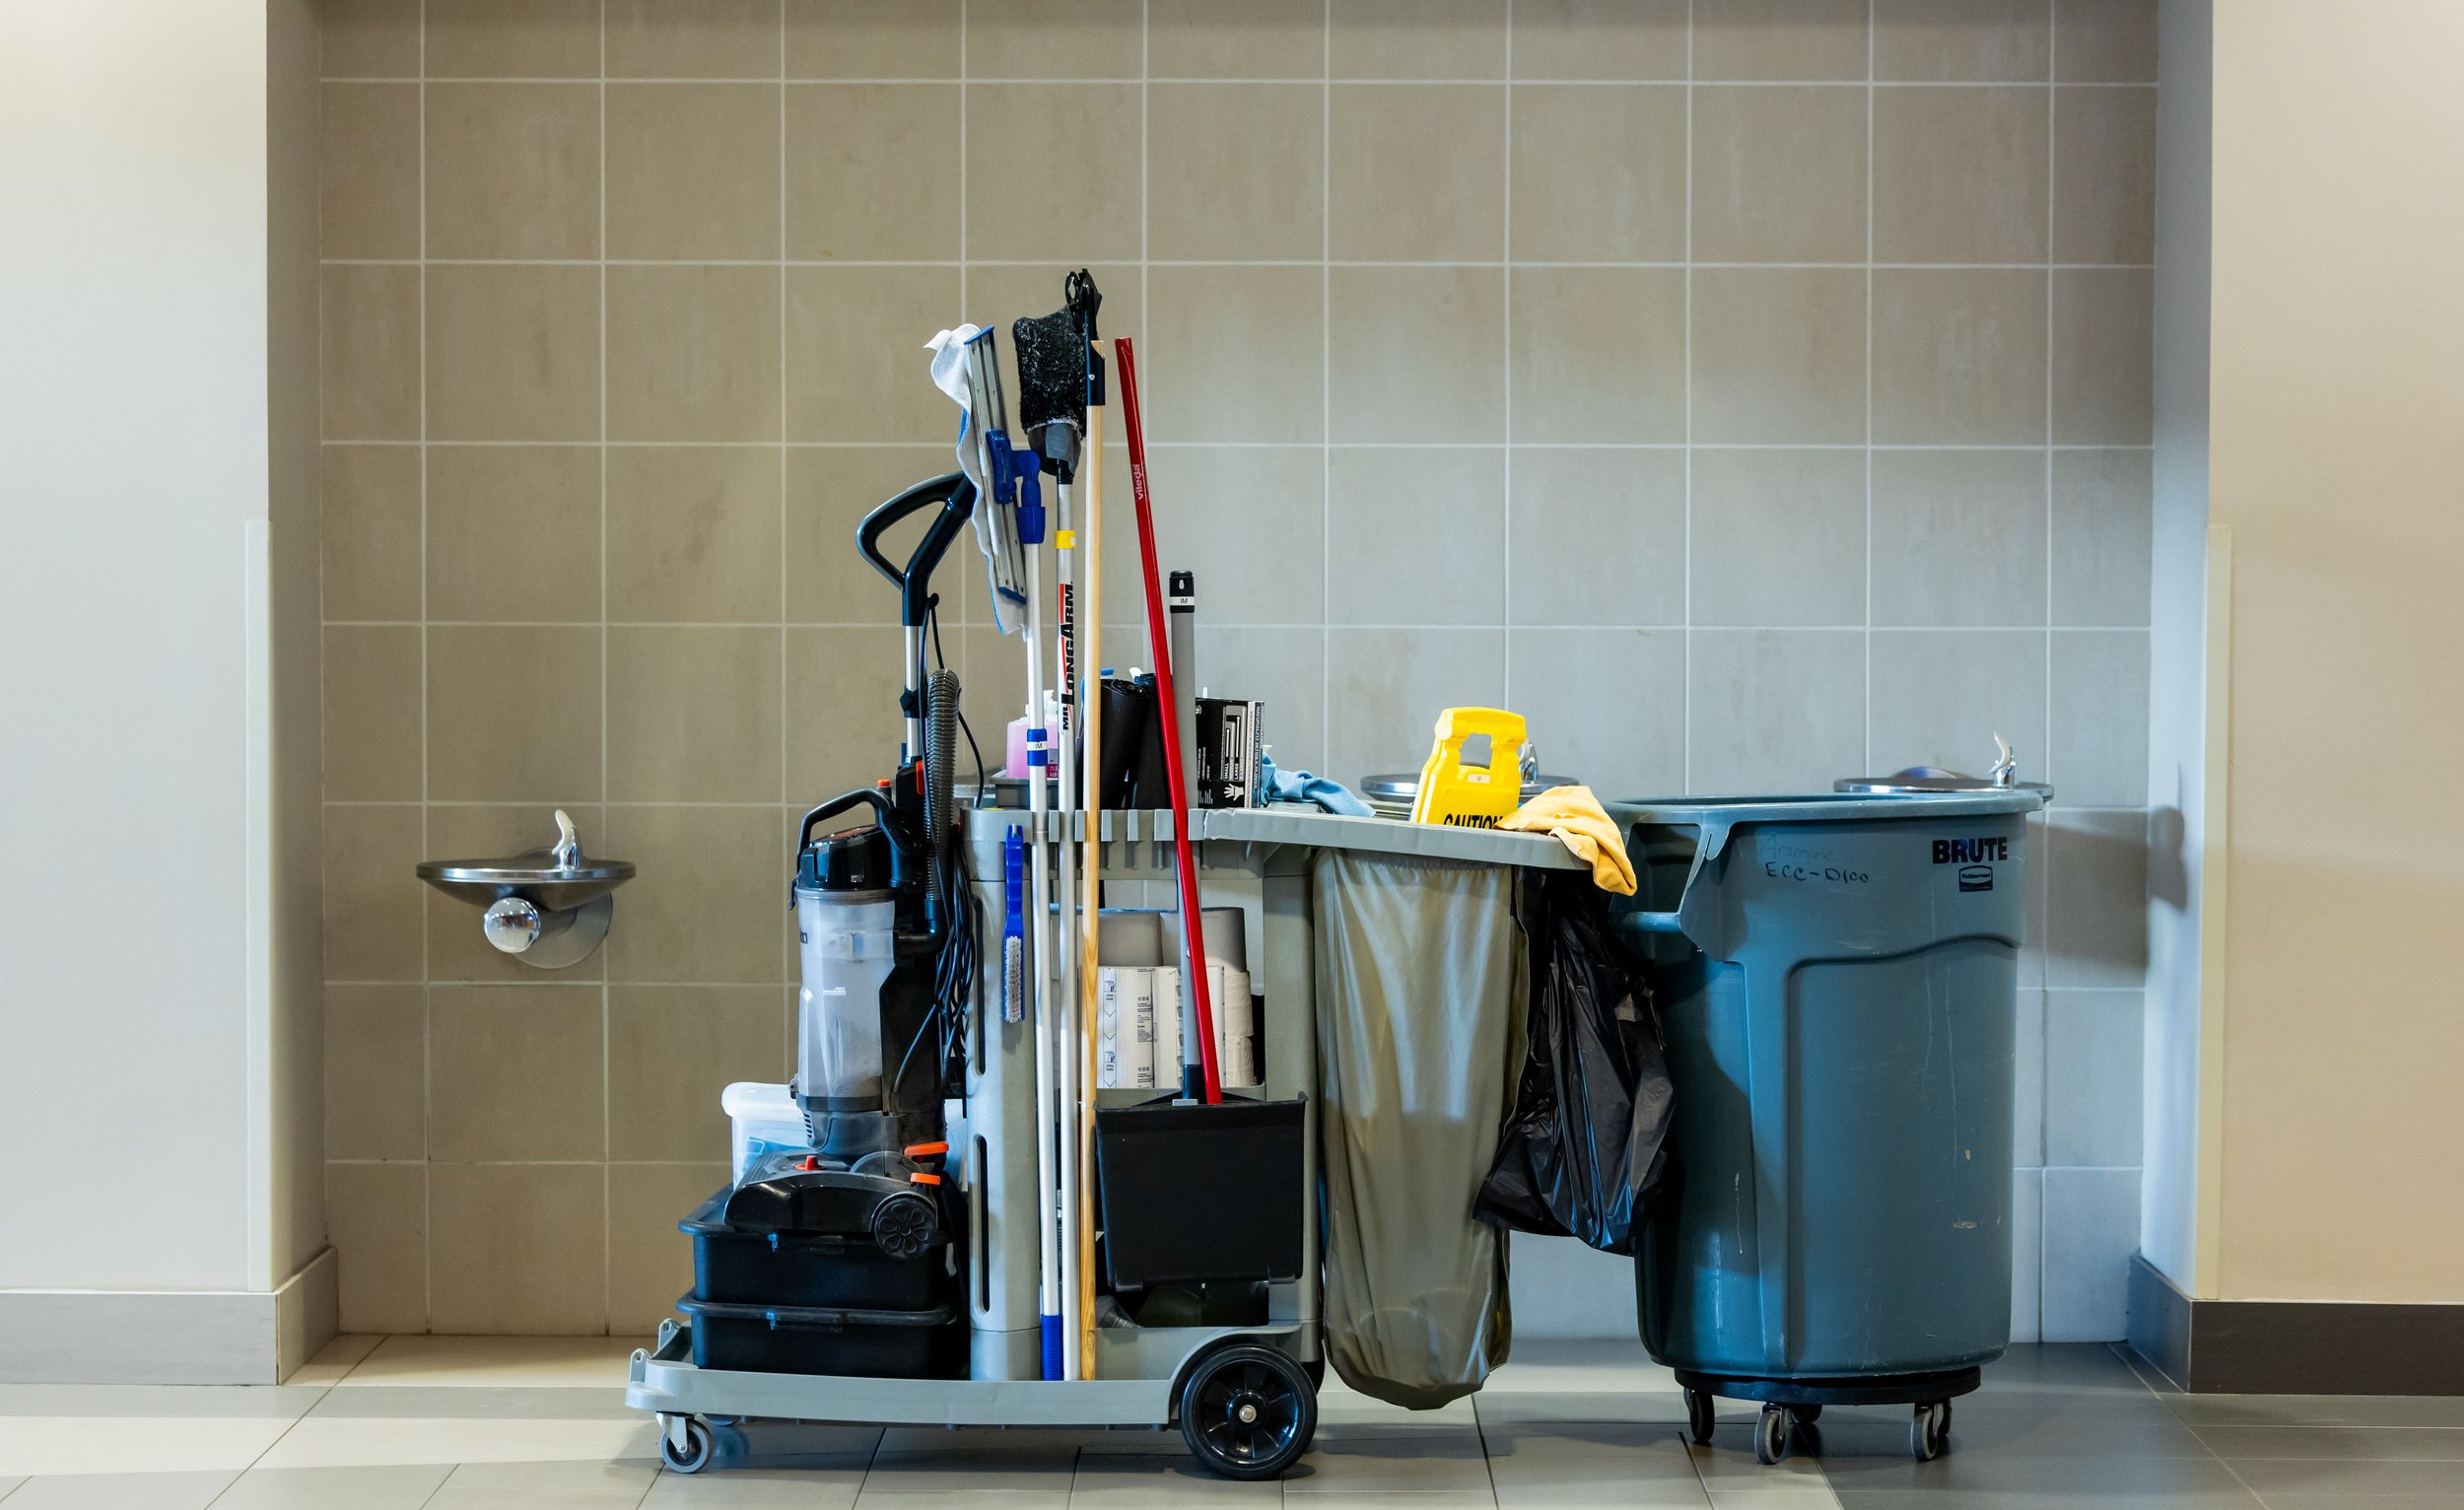
The same cameras that protect your site after hours can work for your business during the day. Heatmap Analytics runs on your existing monitored cameras, so there’s no separate sensor network and no extra hardware to install. You get one platform for both security and store intelligence. Pair it with People Counting and Advanced Visitor Analysis for a complete picture:
How
How many came in?


How
How many came in?
Where
Where did they go?
When
What did they do?

FAQs
-
No. Heat maps are aggregate patterns of where people have been detected — they measure spaces, not persons, which keeps the analytics privacy-friendly.
-
A counter tells you how many people entered. A heat map tells you where they spent their time once inside. Together they show conversion of foot traffic into engagement.
-
Yes — the measurement period is configurable, so you can contrast weekday vs. weekend, before vs. after a reset, or season vs. season.
Where
Where did they go?
When
What did they do?